
Uncategorized
Reducing the size of Docker Images 
Richard Woudenberg 18 Mar, 2015


Amsterdam’s Schiphol Airport is one of the busiest airports in the world. It handles over 70 million passengers per year and over 500.000 aircraft movements per year. Currently, Schiphol is reaching the limits of its operational capacity. In order to keep delivering high quality service to its travellers, Schiphol is looking for all kinds of ways to improve the experience. One of the most annoying and frustrating experiences for everyone involved (passengers, airlines, but also the airport itself) is delays. In order to combat flight delays, a data driven approach has been taken to gain insights into the processes that may be causing the delays, from arrival to departure and every step in between. The ‘turnaround’ process is an important part of this. In this blog we’ll be discussing how we used Tensorflow and Kubernetes (among other things) to gain valuable insight into the turnaround process.
In one sentence, a turnaround is the process of "turning around" an aircraft from an arriving flight to a departing one. More formally, this process is defined as the time spent between "on-block" and "off-block", or in layman’s terms "arriving at the gate" and "leaving the gate" respectively. Activities such as deboarding and boarding of passengers, unloading and loading baggage and cargo, catering, refueling, and de-icing take place during a turnaround. Most airports have no automated insight in these activities as these are organised by the airlines. Moreover, each airline may have agreements with one or more handlers to actually perform the various actions required. This all creates a complex landscape, with many parties performing various tasks, in different orders, and in different ways. One could almost call the turnaround a "black-box" in terms of when the activities happen, the duration or order of the activities.
There are several ways in which insight into this process could be very valuable and useful to reduce flight delays. One often-cited example that is easy to understand is that if an aircraft has not been refuelled 10 minutes before its scheduled departure, it is very unlikely that this aircraft will be able to leave the gate on time. This information can be used to optimize the airport’s operation in such a way that the effect of such a delay is minimized, and is not cascaded to other flights. It could also be used to perhaps intervene immediately and get the fuel truck on its way to the gate. There are a lot of potential use cases.
In this blog, we won’t elaborate further on these. Instead, we’ll focus on how we generate this information, as it clearly has significant value.
Before diving into detail as to how we can solve this problem with Data Science & Engineering, let’s take a moment to briefly summarise what the approach will be. Due to the complexity of the landscape (e.g. the number of parties involved) gaining insights into what’s going on during a turnaround is not a trivial process.
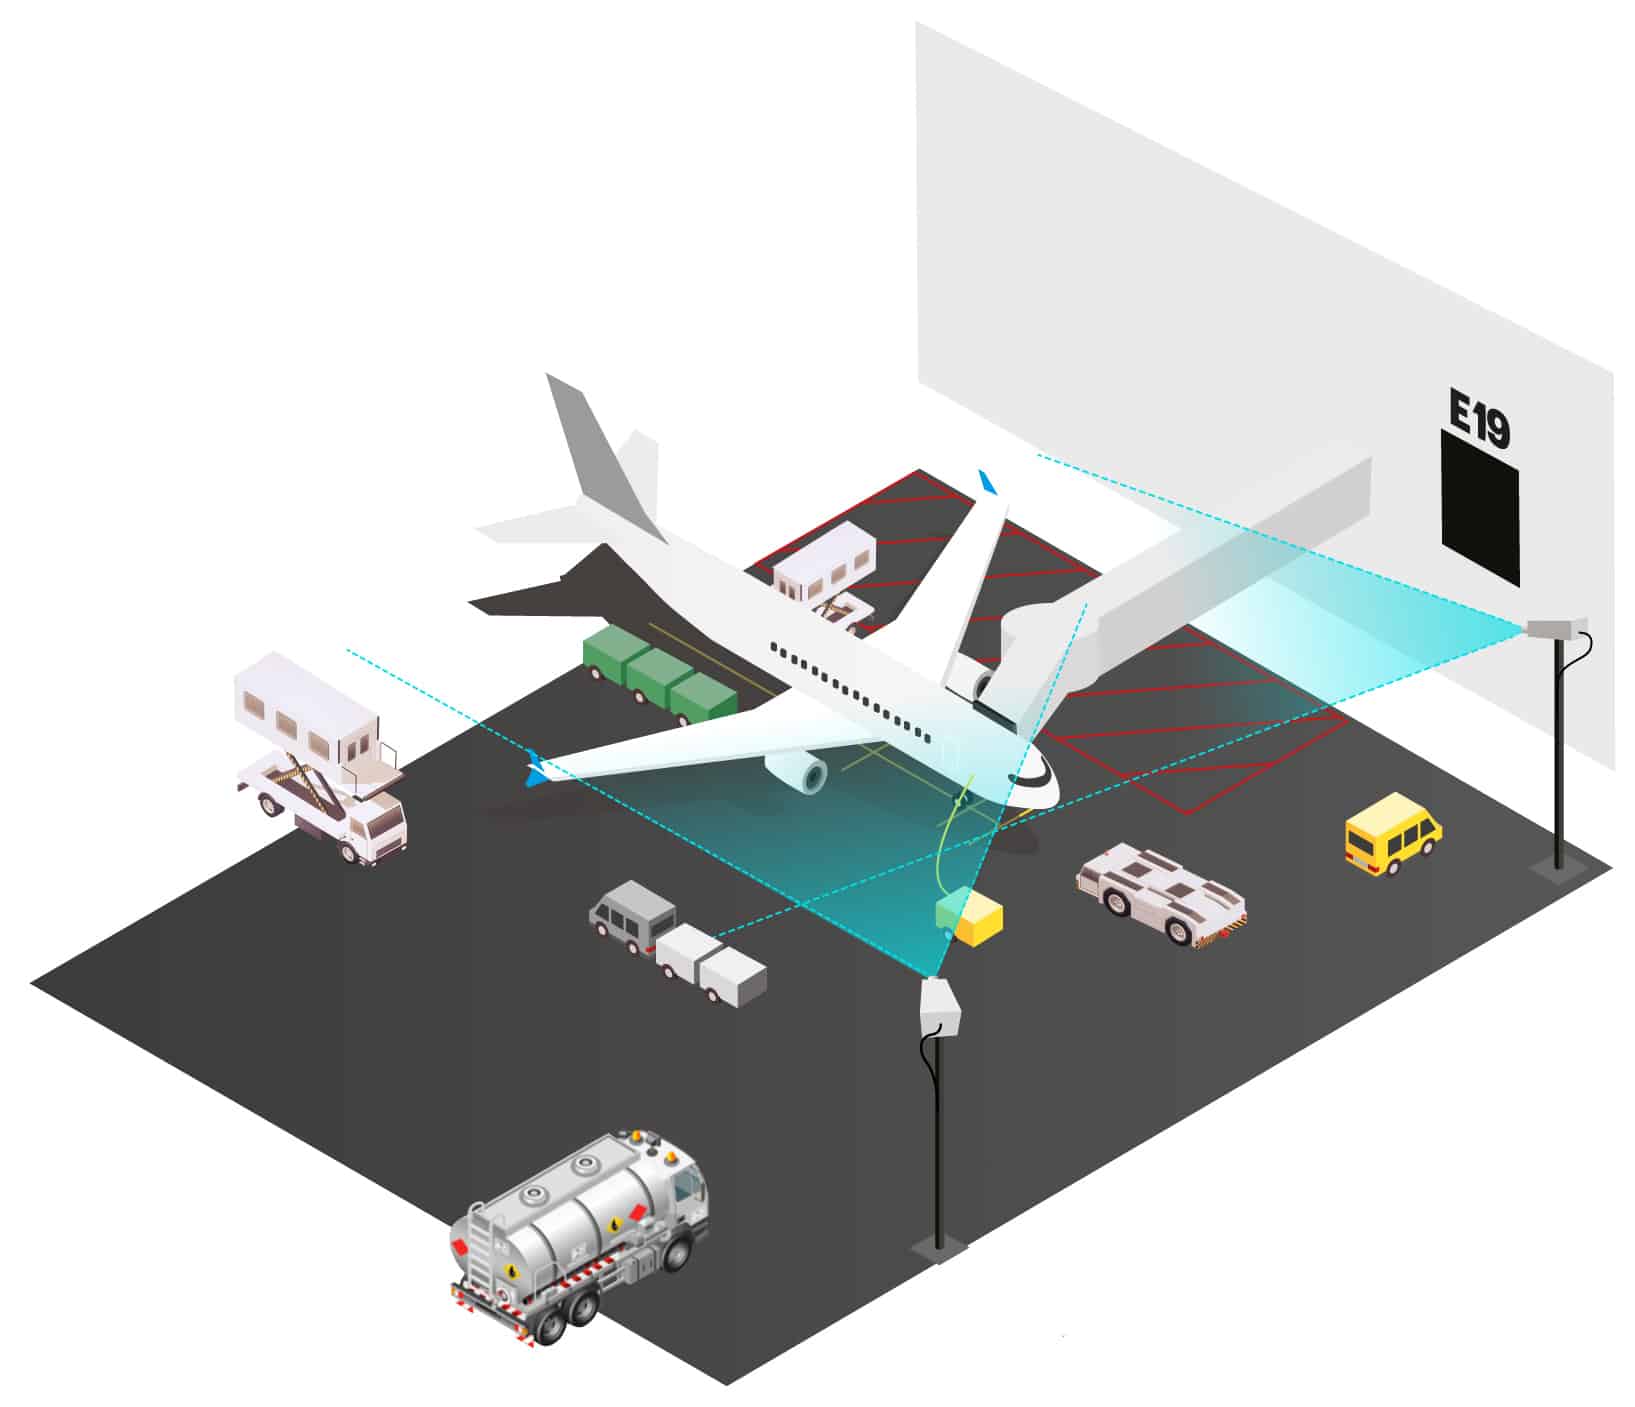
One approach is to use cameras that provide a video feed. Rather than requiring the installation, configuration, and maintenance of possibly hundreds of sensors that would need to be coordinated with dozens of parties for each gate, using cameras has the huge advantage of requiring much less infrastructure. In fact, in some places the cameras may already be in place. Each camera will stream snapshots of its videofeed into our pipeline at regular intervals. Our pipeline will take these images in, perform some black magic (otherwise known as Data Science), and output events. Examples of these events could be AircraftStopsAtGate, CateringTruckArrivesAtGate, or RefuelingEnds. These events can then be used to get insight into what happens during a turnaround and, more importantly, when exactly.
Although our solution is a software-based one, we still require some hardware
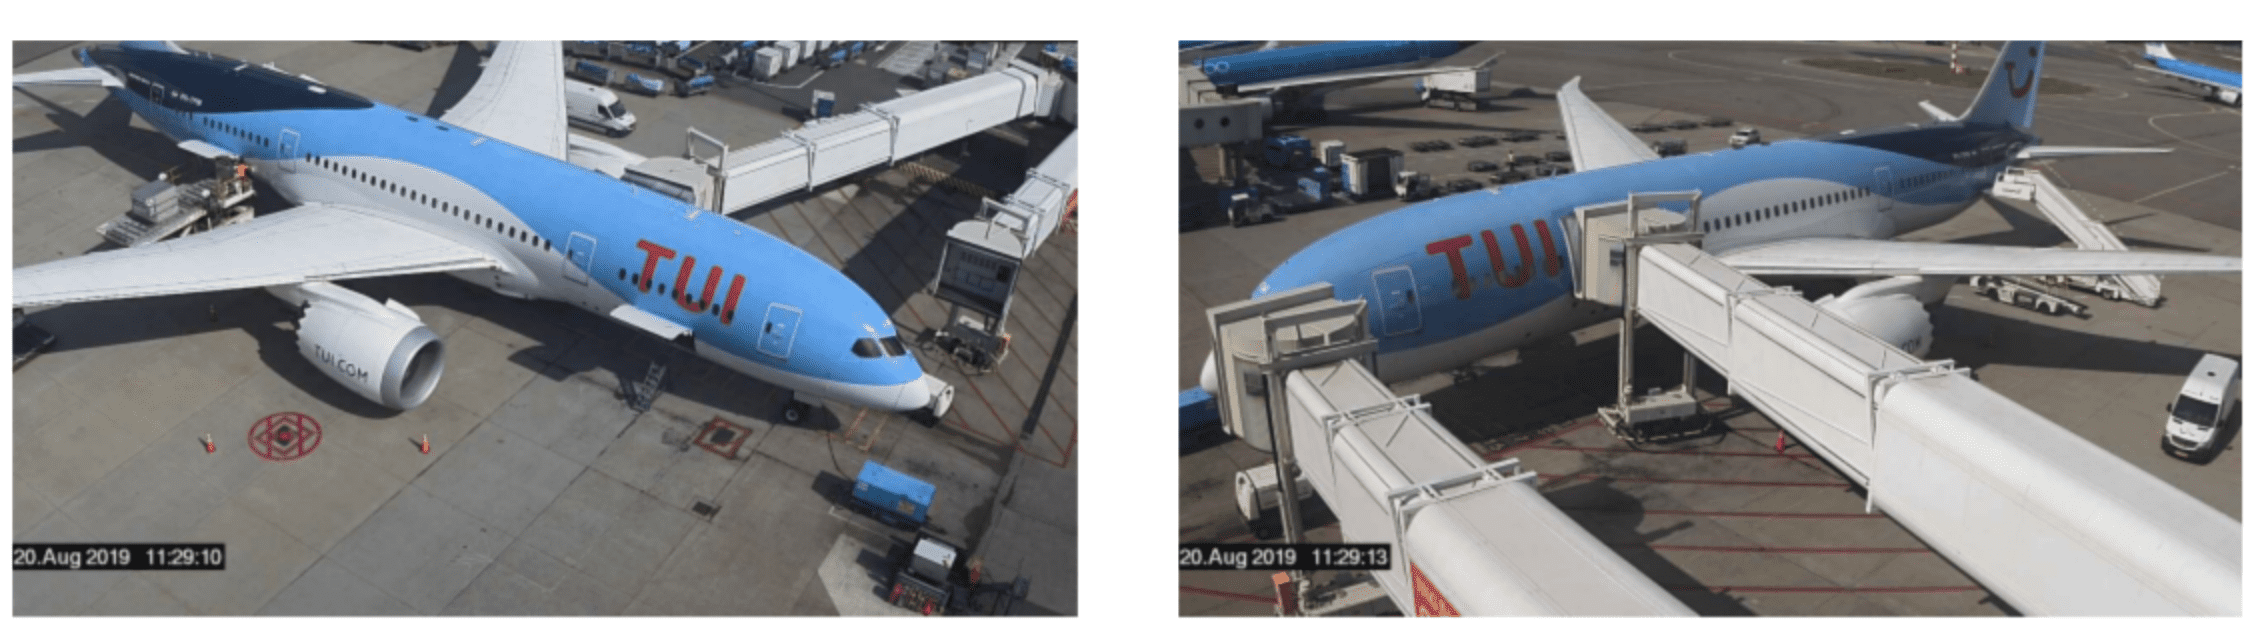
Before diving into the software setup, it’s good to discuss the physical infrastructure involved a bit more. In our case, we performed some experiments with 2 different setups of cameras:
In terms of physical infrastructure, option 1 would naturally be preferred. Unfortunately, aircraft wings and engines tend to obscure the view a lot, leading to a lot of objects not being (completely) visible from this single camera. Option 2 gives us the benefit of being at an angle, and slightly elevated, which allows us to look over the wings. Moreover, having two cameras in place allows us to correlate the images from the two cameras to avoid erroneous detections.
One often-asked question is whether edge-computing would be an option here. In short, yes it would. However, generally speaking the biggest advantage of edge computing is reduced network traffic. In the case of Schiphol (and airports in general) the geographical spread is quite limited. Also, a dedicated network connection to the cloud was already in place. Edge computing would also require considerably more on-site maintenance of each device than just a camera. Given these considerations, we chose to use a software based solution.
Let’s take a closer look at the "black magic" we mentioned. What does the pipeline that goes from raw images to events actually look like?
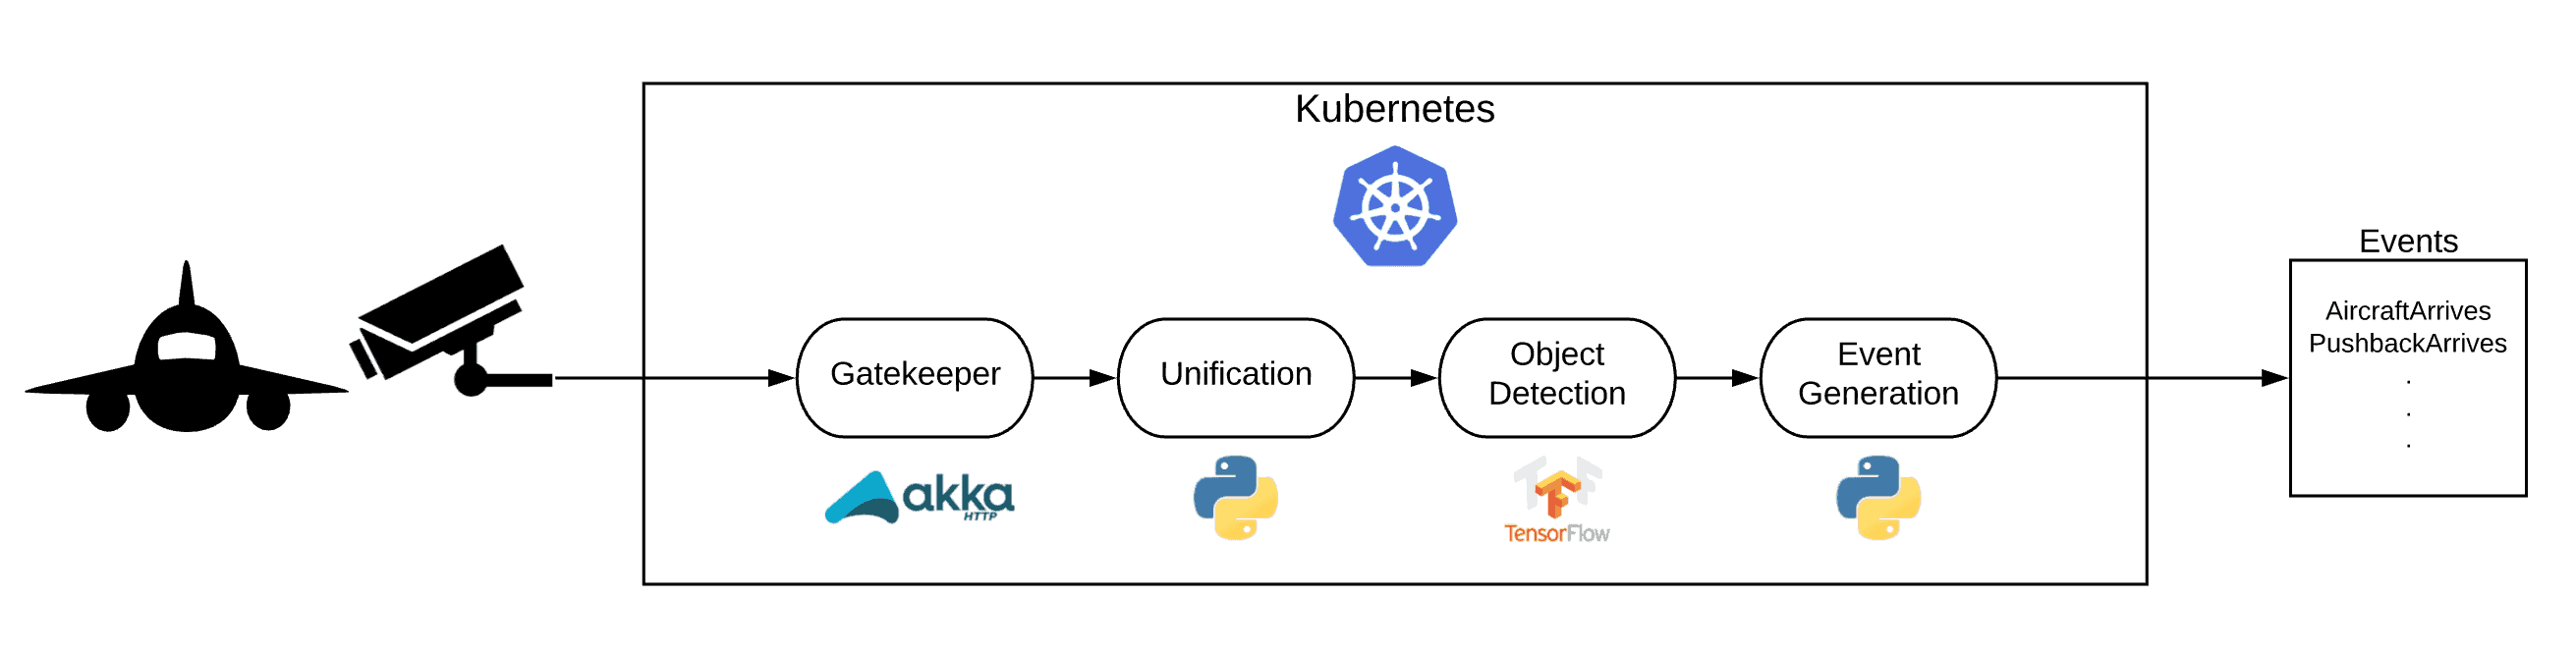
At a high level, the flow can be described as follows:
In this process, as you can see in the image, a number of technologies are used. While there may be valid alternatives for each of them, we’ll use the following stack throughout this post:
To decouple the streaming platform from the software on the cameras a service we built a service that acts as a REST endpoint for the cameras. This gatekeeper will accept POST requests with images and will forward the images as messages to the message bus. This allows us to change our complete backend, message bus or anything else while the interface between cameras and the pipeline will remain unchanged.
The cameras operate fully independently. One downside of this is that images arriving at the pipeline are not synced up and don’t have a message id. For our pipeline, however, we need to have two images that represent data for a single point in time. In order to achieve this, we built a ‘unification’ algorithm based on the timestamps of the arriving images. The algorithm buffers up the images for a certain time period, and tries to make pairs of images, with one image coming from each camera.
<<>>
<<>>
Ideally every object responsible for any of the turnaround activities must be detected from the images. These are include objects such as:
As mentioned, our Data Scientists built an object detection model using Tensorflow. Luckily, they did an awesome job and achieved incredible accuracy and precision scores in terms of correctly recognising all the various objects and vehicles involved in a turnaround. We won’t steal their thunder of unveiling how they achieved this in this blog post ;-).
One downside is that they built the model in a complete batch scenario, mainly due to the fact that when they started on the model, there was no stream of data available. Of course, for our users, (near) real-time insights could be very valuable, as it would allow them to react quicker to possible deviations or perhaps reshuffle their planning if they realise an aircraft won’t be able to leave on time. Because of this, we needed to get the object detection model running in a streaming manner.
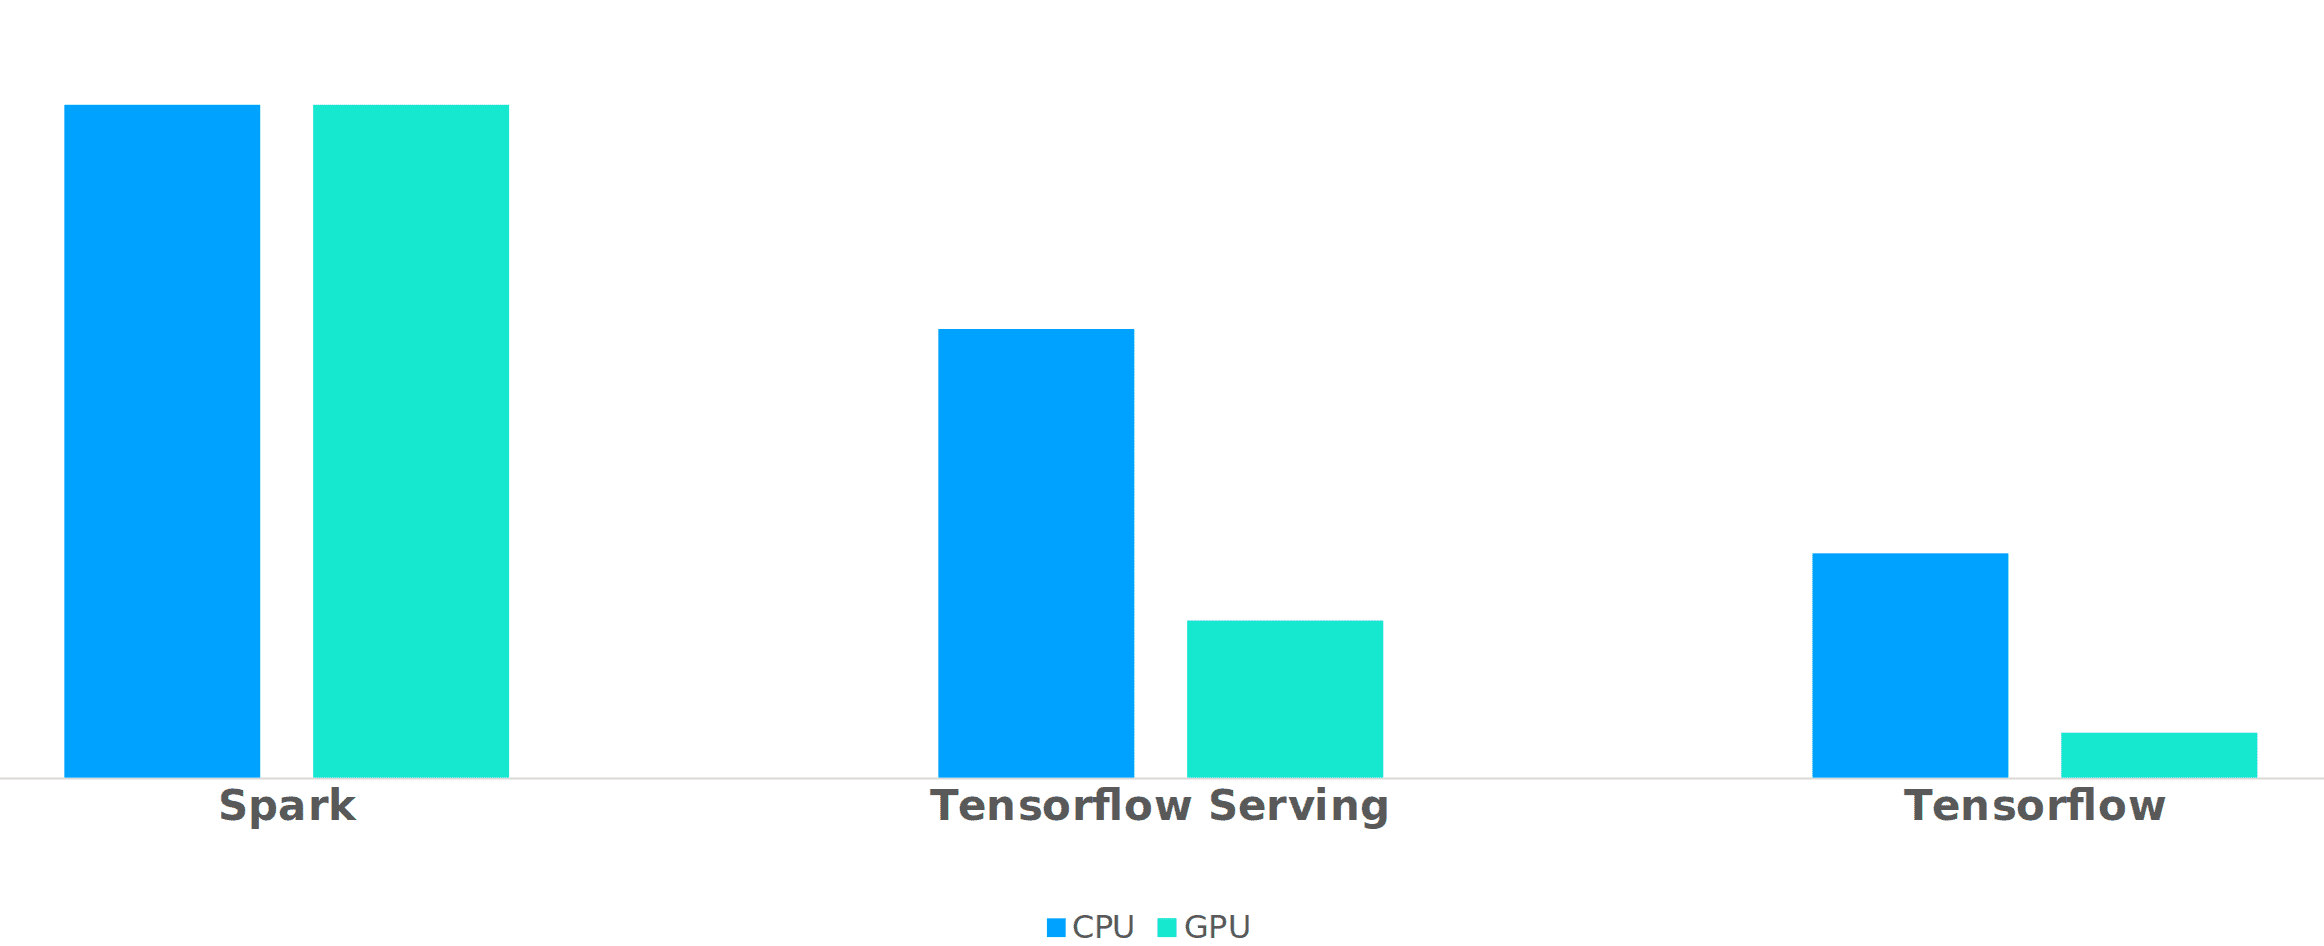
It would be insincere of us to suggest that we landed on our final solution immediately. We iterated quite a bit, first trying to run the inference on top of Spark (as Schiphol had the infrastructure readily available for this). We also used Tensorflow Serving (https://github.com/tensorflow/serving) for a while. Tensorflow Serving works well, but introduced extra complexity of requiring a REST/gRPC interface, and thus also a service that could interact with this. It did work very well out of the box, and we recommend it to anyone wanting to quickly make a Tensorflow-based model available.
In the end, we managed to get this to work quite elegantly, by plugging the Kafka consumer directly into the Tensorflow code we had in use for batch inference. Our biggest question was, however, whether or not we had to use GPUs for inference. Our Data Scientists were adamant that it was necessary, as it was the case for training, and for large-scale batch inference. However, with some tweaking, we managed to get inference time per pair of images down to roughly 1s per image. The biggest gotcha for us (being new to Tensorflow) was to re-use the Tensorflow session, rather than spinning up a new one for each message. In the end, our inference loop was roughly this:
with detection_graph.as_default():
    with tf.Session() as sess:
        tensor_dict = get_tensors()
        for message in kafka_consumer:
            data = parse_message(message.value)
            results = run_inference_for_dual_images(data, sess, tensor_dict)
            send_message(results, producer, topic)
Of course, being curious engineers, we did some rough benchmarking of the solutions, which can be seen below. Please note that we omitted the Y-axis on purpose, as we do not mean to claim any scientific relevance to specific figures :-).
Having performed object detection on the images from the cameras, we now have a (near) real-time feed of information on what objects were present at a particular timestamp. While interesting, working with this data would be tricky and would require relatively advanced tooling, which our business users would not have easy access to.
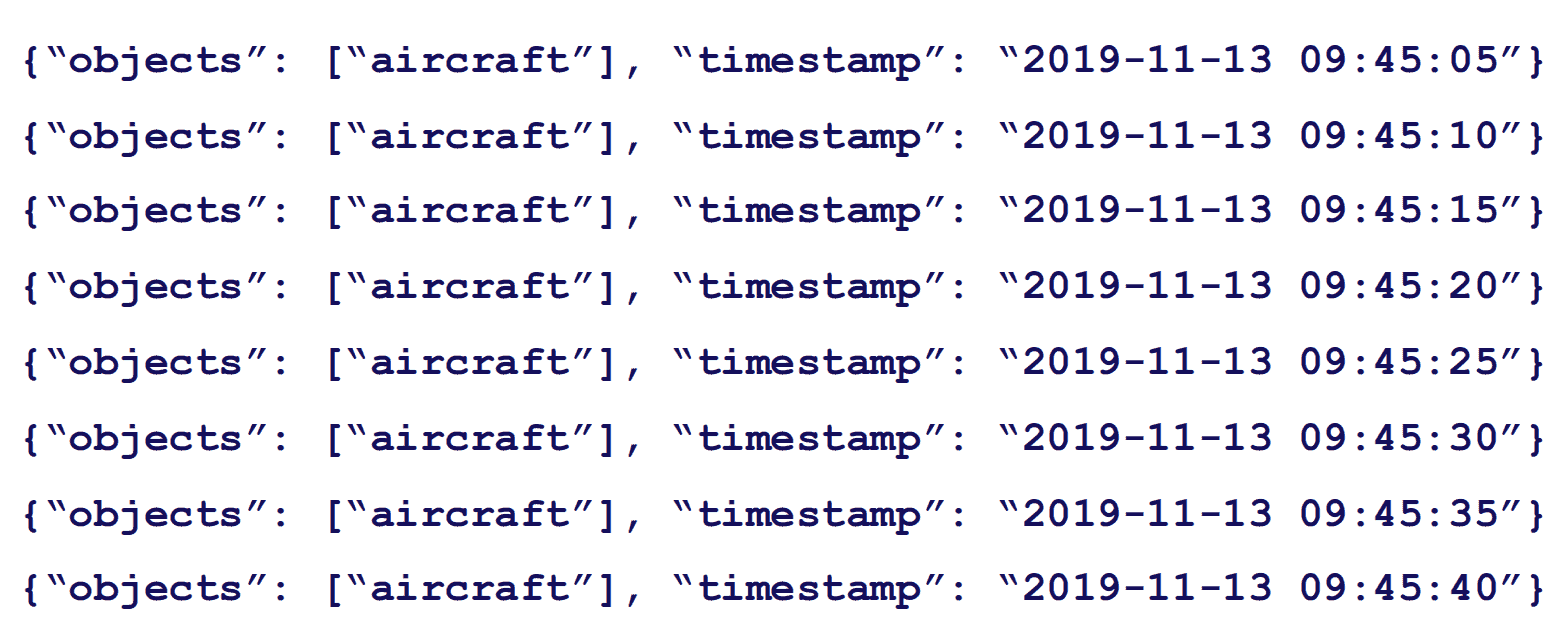
The event generation component of our pipeline takes the detections and aggregates these into more human-friendly events such as:
We need to do a bit of windowing for a few reasons:
All of the reasons mentioned above mean we lay a simple sliding window over the detections as they are streamed into the event generator. Once the window has been updated, a set of business rules is executed to determine whether or not an event should be generated. To give some insight into what such a business rule looks like, we’ve provided some pseudocode here:
if fuel_truck is present or aircraft is not present:
return
num_present = 0
for observation in window:
if fuel_truck_detected:
num_present += 1
num_present_ratio = num_present / window_size
if num_present_ratio > presence_threshold_ratio:
trigger_event(fuel_truck_arrives)Each event is defined slightly differently in order to accommodate the specific characteristics of that event. You can imagine, for instance, that the presence of a given truck may not be of any interest if there is no aircraft visible at that point in time (perhaps the driver is stopping for a cup of coffee 😉 ).
The events produced by the event generation step allow us to get real-time insights into what’s happening in the turnaround of an aircraft. Plotting these timestamped events in a gantt is very useful too, as it gives you a good overview of what processes were going on at what point in time:
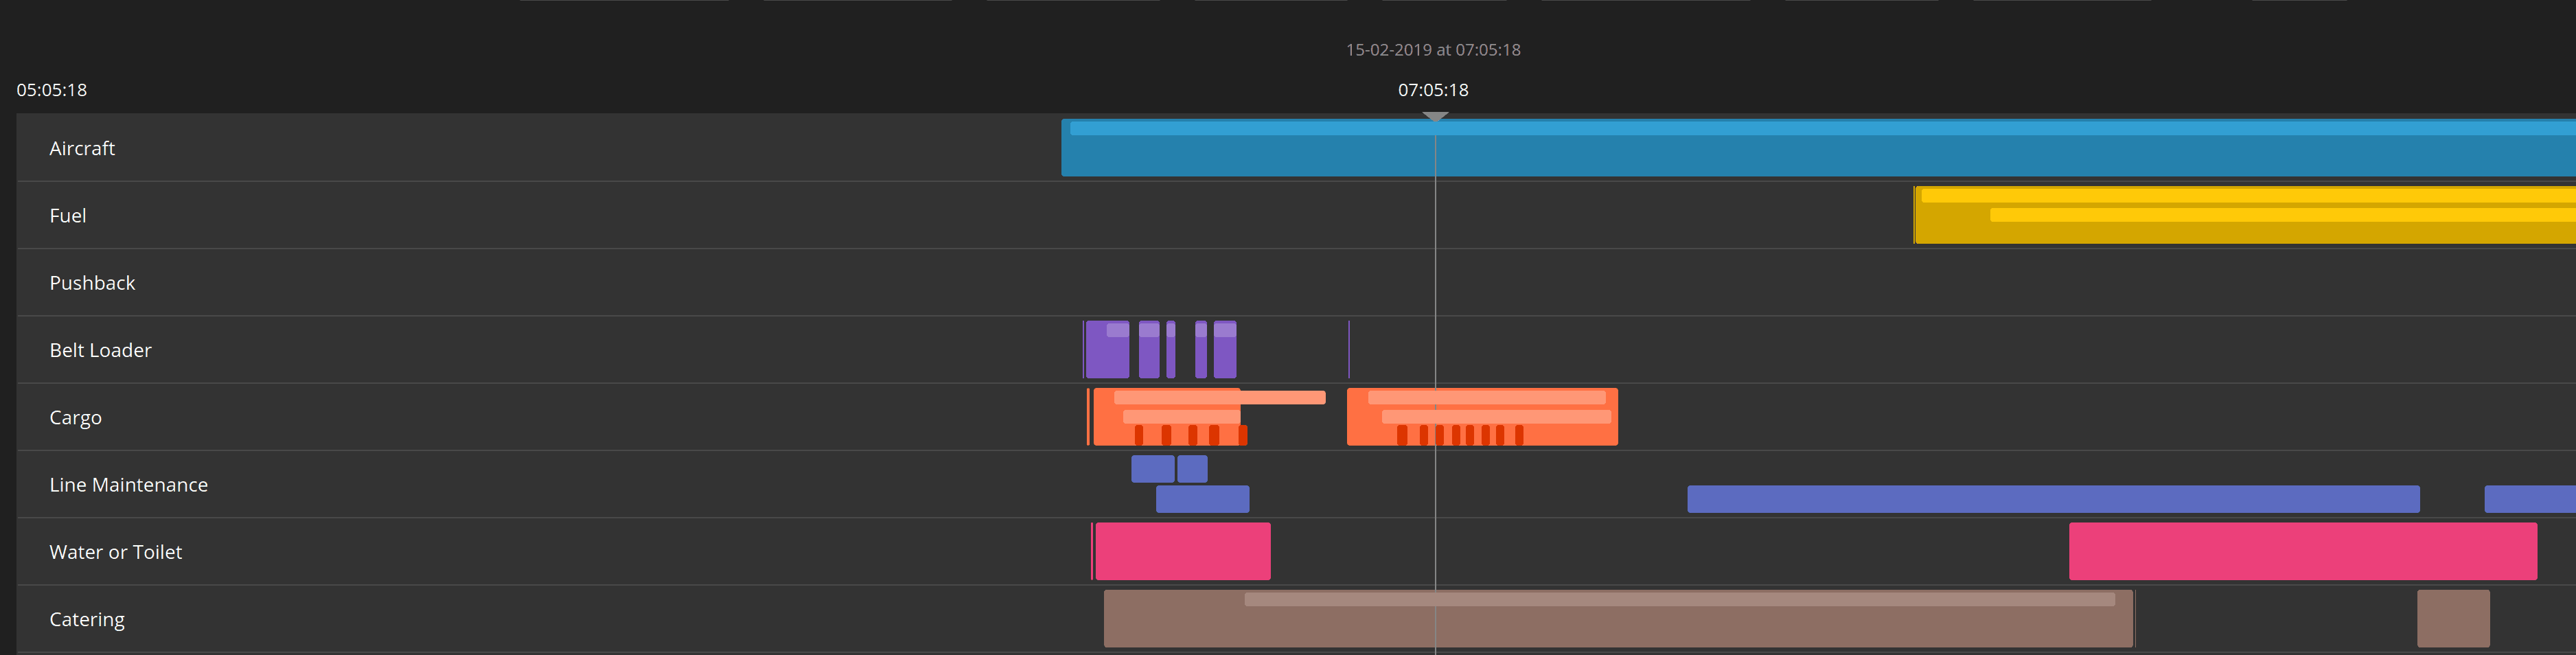
This will allow operations to better understand what’s going on and possibly intervene if necessary and appropriate.
To summarise, we have built a end-to-end streaming pipeline that takes images in and outputs operation events, that can be used to optimise the turnaround process of aircraft at Amsterdam Schiphol Airport. This system is currently still being further refined, but we wanted to share this first version already. If you have tips, tricks, comments, or questions about any of this, don’t hesitate to reach out! We’d love to hear your thoughts!
If you’d like to hear more about how this project has been developed further, we’ll be giving a talk at Kubecon 2020 in Amsterdam on April 1st. Details can be found here

