When you find yourself building a prediction machine where you are both looking for the best model and a fair estimate of its performance this blog is for you. Especially so when you are working with time series data.
What are we predicting?
Place yourself in the shoes of John who manages the security guards at the airport gates. To do his work well John wants to know how many people will arrive at the security gates so he can make sure there is enough staff to keep things running smoothly, but not so much that money and time is wasted.
People arrive at the airport via different modes of transportation, for example by car, train or taxi. The input for John’s prediction problem thus can be multivariate. The output is just the number of people expected at the gate (assume a single gate or security check) at each point in time.
Using historic data John can train a prediction machine (model) that he can use to get an estimate on how much staff to schedule. The cost of having too little staff is higher than having too much. Therefore John wants to know how confident he can be about the predictions, so he can plan on the safe side.
It is important to realize that John has two goals which are tightly connected. In this blog you will learn about a method to combine the selection of the best model and its evaluation. In other words, which model should John use and how confident can he be of its performance.
Note that we are not talking about time series forecasting, but about prediction with data that can contain time-based information. The image below visualizes the difference between the two settings. In our scenario (arrow from input data to prediction) the input data contains information about the expected use of cars, trains and taxi’s for today with which we try to predict the number of people we expect at the gate today. In the forecasting case (arrow from input data to forecast) we could for example use information about the weather and day of the week as input data for today and try to predict how many people will use the car, train or taxi tomorrow. Clearly, these two settings are very much related, but our focus is on the former. The image below might help in showing the difference.

What’s the approach?
Summarizing the above we are dealing with the following scenario:
- in search for the best model
- in search for an unbiased estimate1 of the best model’s performance on recent data2
- working with time series data
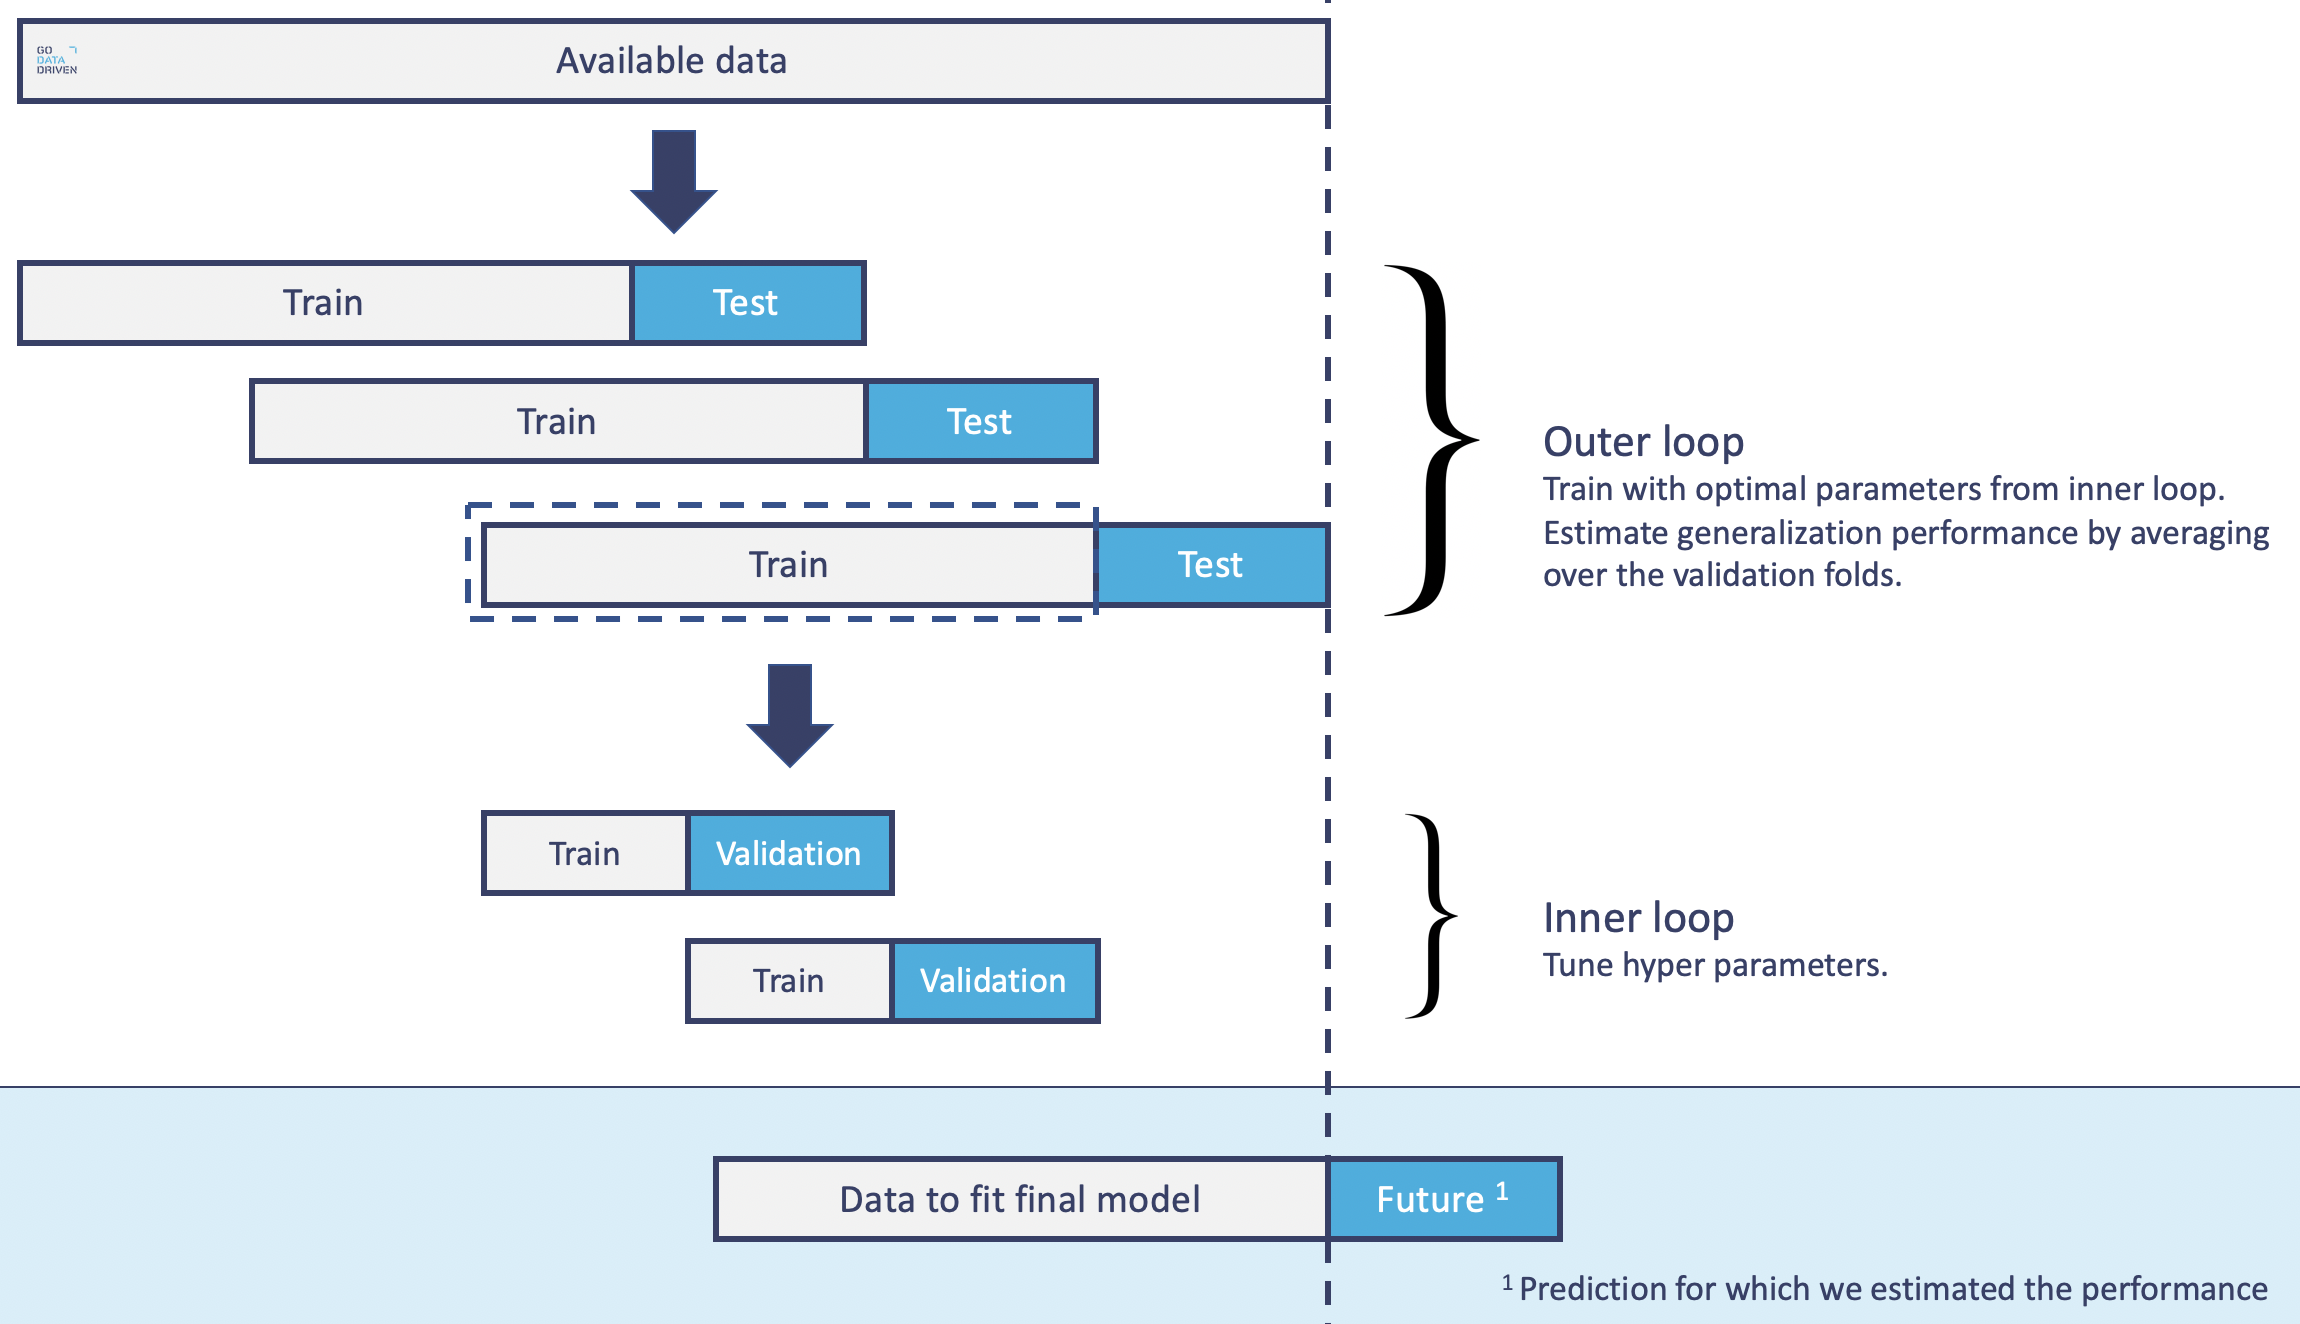
Inspired by Sebastian Rashka’s great blog we tailored his nested cross-validation to our setting with time series data. In short, the outer loop of the cross-validation is used to estimate the generalization performance. And the inner loop, which is performed on the train set of the outer loop, is used to tune the hyperparameters.
Note that this is a very specific setting and we do not claim that this is the best approach in general when dealing with prediction and time series. It is, however, important to make sure that you don’t leak any information during training and testing with time series data. Also, it’s important to understand that searching for the best model doesn’t automatically give you an unbiased performance estimate of this model if you don’t use the right setup. That is why we tailored the nested cross-validation framework to this setting to give us what we’re after.
Time series cross-validator
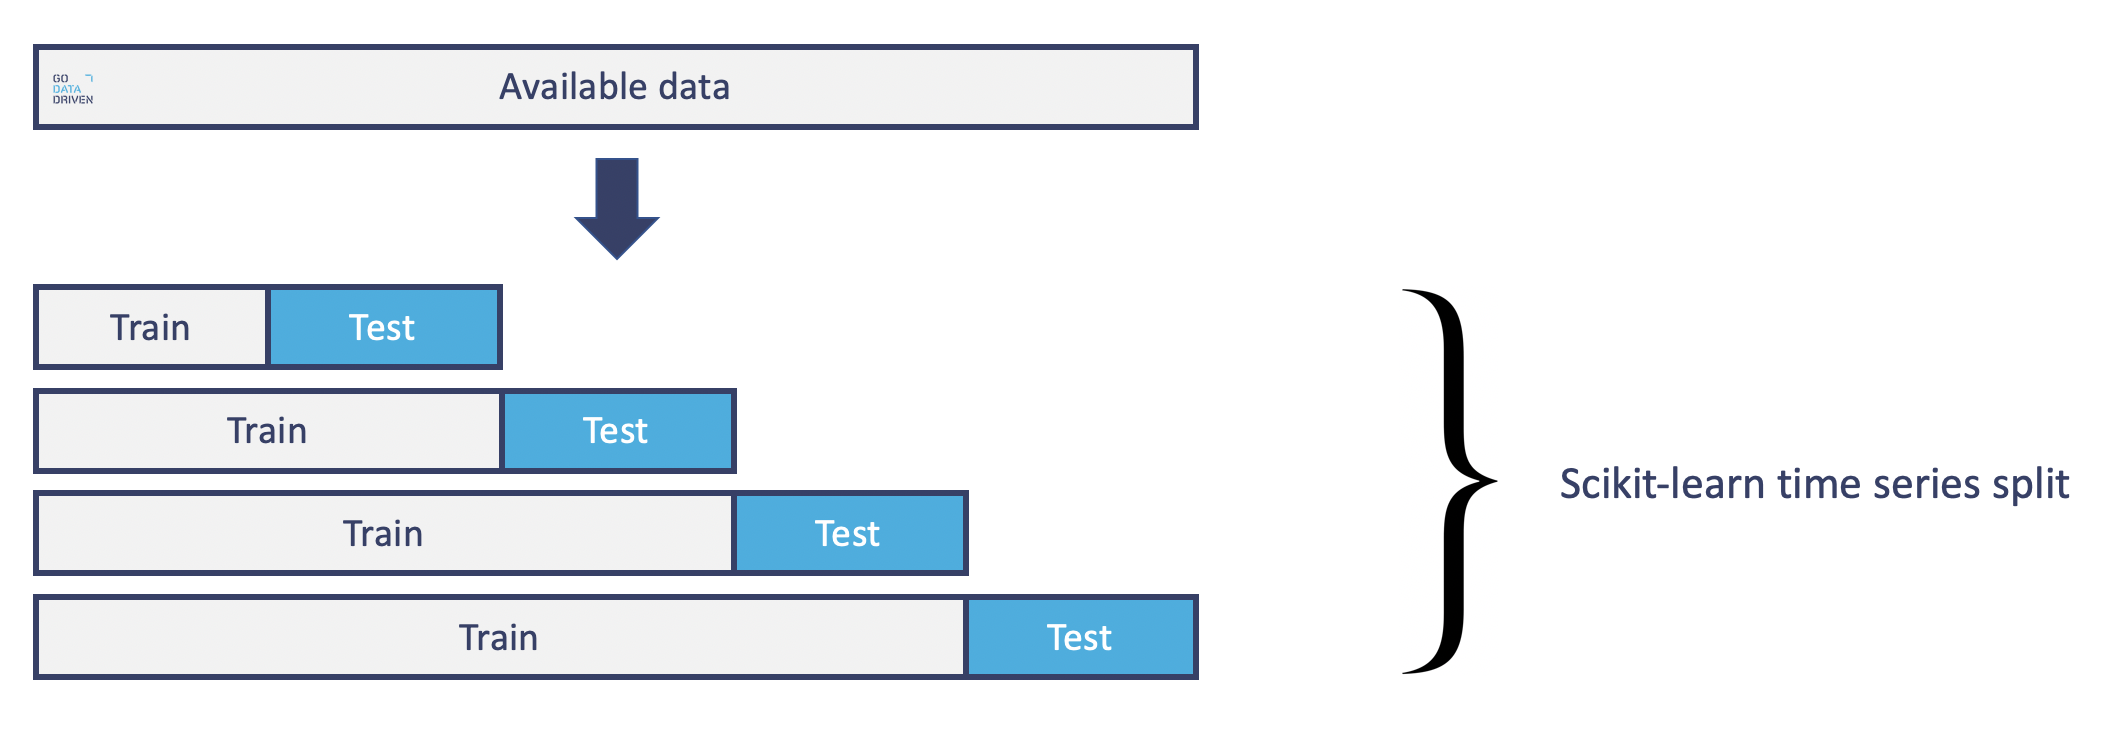
The first thing we need is a cross-validator for time series. There already exists a time series cross-validator which is a variation of Kfold with the last fold as test set and all previous folds as train sets. The train set thus grows in each next split.

We want to keep the size of the train set constant so each iteration in the cross-validation is comparable. So we wrote our own custom time series splitter where both train and test set can be of variable size but have the same size in each split. Combined with the nested cross-validation, schematically this looks as follows.

Why this setup?
The idea for this splitter is that we want to simulate a setting in the outer loop that is similar to prediction time when we will use the final model. The final model will be trained on the most recent data (same size as train set from outer loop) using the same inner loop to find the best hyperparameters. Now that the setting at training time is similar to prediction time we can trust our performance estimate (performance for test sets from outer loop) to be fair.
Further, we make sure that there is no overlap between the test sets and that only historic data (train set) is used to search for the best model before we measure its performance on more recent data (test set).
Final model
When not dealing with time series you will train the final model on all available data when you have made all your choices (algorithm and hyperparameters). However, for our time series setting it might not always be the case that more data will make the predictions better (this depends both on the model and data). Therefore, for our scenario, we choose to fit the final model on the most recent ‘train set size’ (outer loop) data points using the inner loop cross-validator to find the best hyperparameter setting.
Prediction
For this final model we have a good idea about its performance, since we collected performance results during the nested cross-validation in a similar setting as at prediction time. Based on these results we have an estimate to what extent we can trust our model when making predictions for the next ‘test set size’ (outer loop) data points.
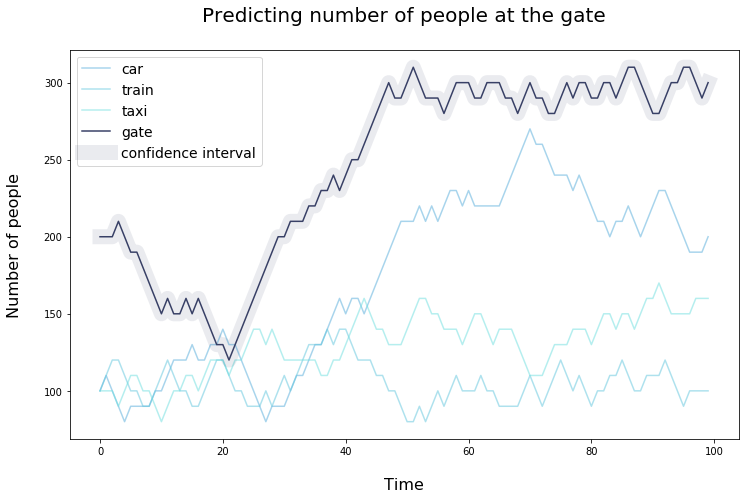
To make this estimate more precise we can create a confidence interval for our estimate using bootstrap sampling. That is, we can combine our prediction with sampled prediction errors from the outer loop test sets to produce many prediction samples. We can then use these bootstrap samples to, for example, get the 95% confidence bounds on the original prediction.
Back to the airport
Using the nested cross-validation John has two things. First, given forecasts on the usage of cars, trains and taxi’s as input data he has a model to predict how many travelers he can expect at the gate. Second, he knows to what extent he can trust his predictions (using bootstrap sampling) and how many staff he should schedule to be on the safe side. The figure below gives an idea of how this might look.

Interested in the code? Find it here. Should I include a section (or code) about the bootstrap sampling? Let me know!
Shout-out to Henk and Stijn for helpful discussions and comments.
Want to create predictions you can trust?
The GoDataDriven course Practical Time-Series Analysis and Forecasting takes you through all aspects of using time-series data to create predictions and forecasts.


