Analytics Engineering | Data | Data Platforms | Domains | Topics
Analytics Engineer - The new buzzword of the data world 
Juan Manuel Perafan 21 Dec, 2020


In this blog we explain the experimentation canvas, a simple tool to help you transform your ideas into viable AI use-cases. The canvas is based on the value chain of data science, shown below.
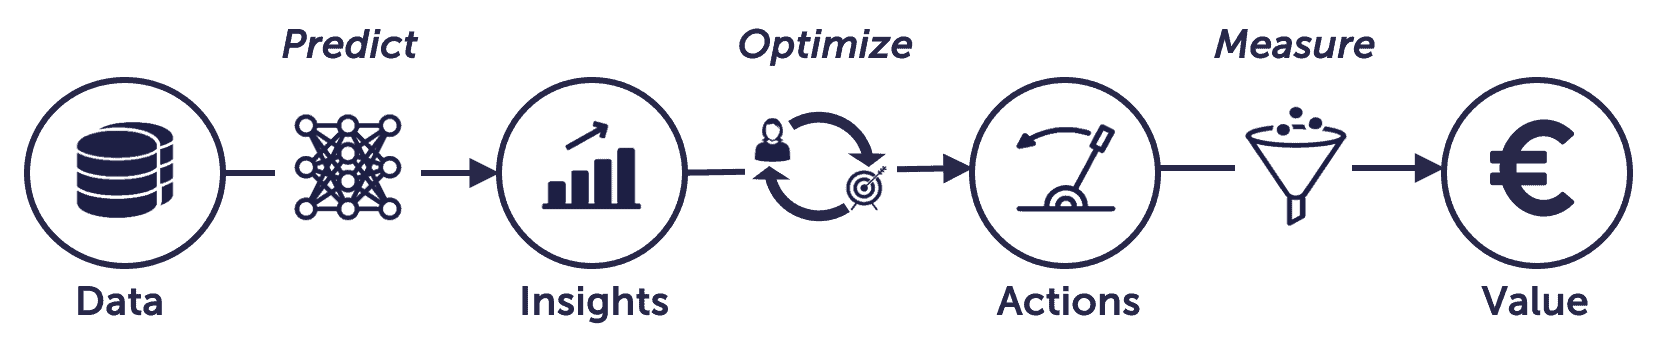
The value chain of data science describes how you can transform data to business value. You define a good use case backwards, from value to data. I will explain with an example:
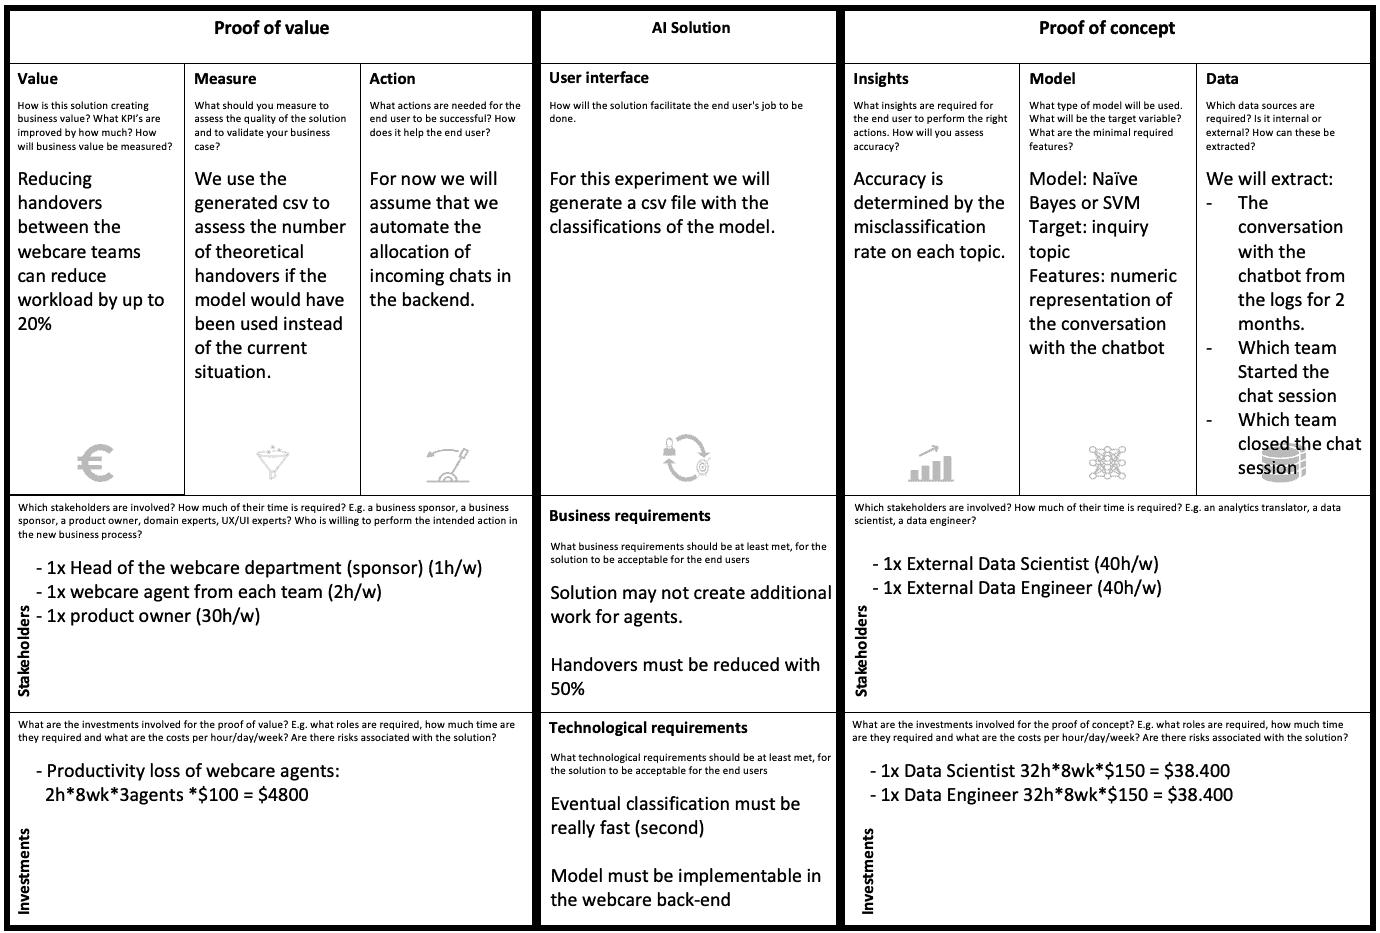
"Our web-care department receives thousands of inquiries per day. The department consist of three teams, each specialised in a different set of topics. Incoming inquiries get forwarded to an agent. Work pressure is high, and approximately 20% of the time is spend on handing over work from one team to another."
Value:
Reducing handovers between the web-care teams reduces workload by up to 20%
Measure:
Number of teams that worked on an inquiry
Action:
Forward work to a web-care team based on a classification model
Optimize:
Cut the number of handovers to different web-care teams
Insight:
Topic classification of incoming chats
Predict:
Text classification model
Data:
The conversation with the chatbot, before connecting to an agent
By following the value chain you remain focused on your goal. You starting at the value, and work backwards to the data.
Now that you’re familiar to the value chain of data science let’s take a look at the experimentation canvas. The value chain is built into the canvas. Note that it has been setup to start with the backwards flow of the value chain.
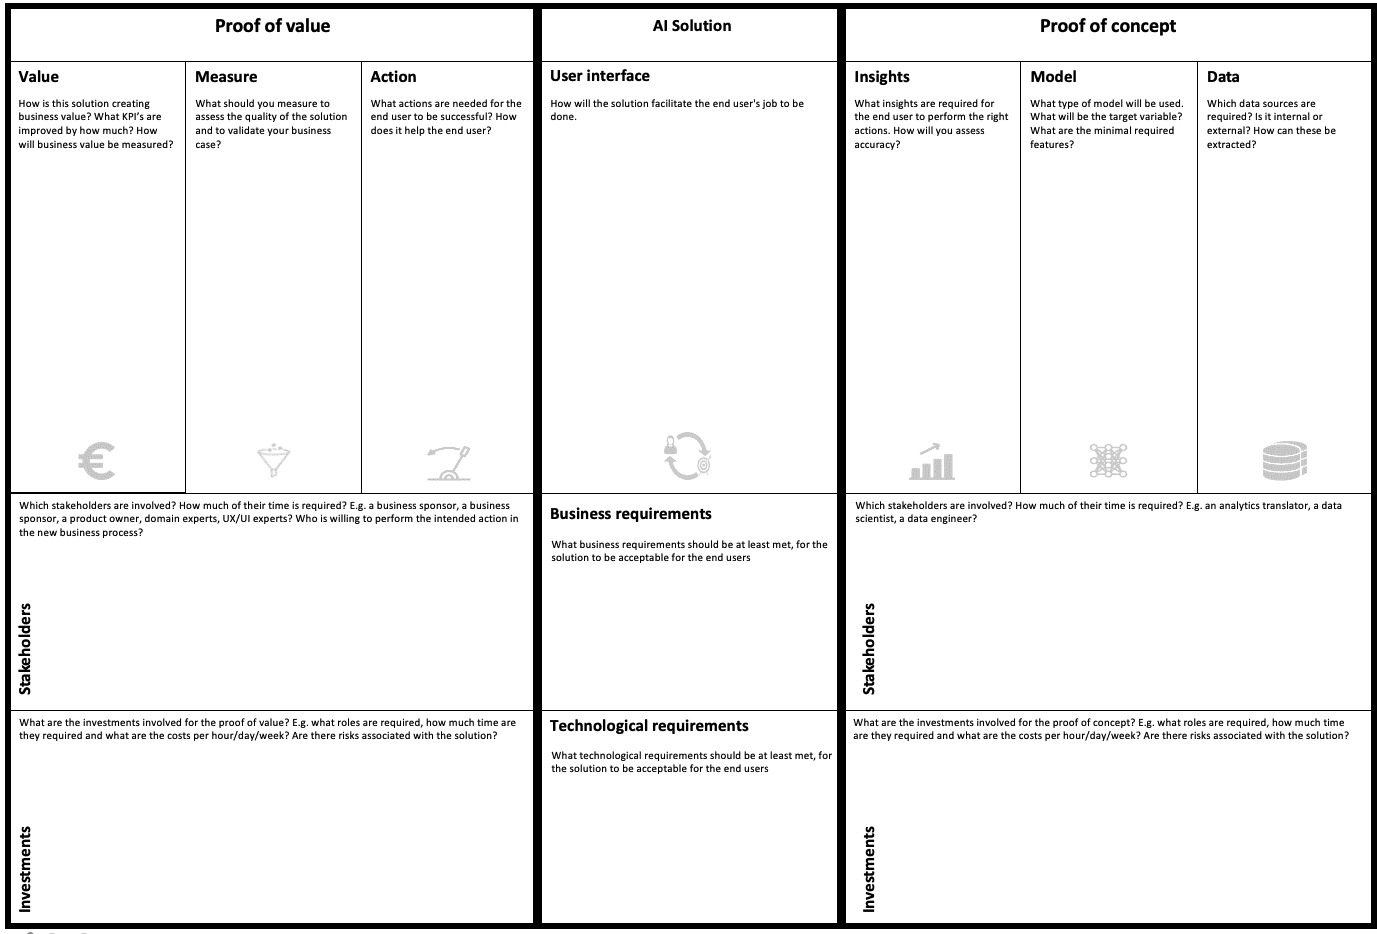
Some of the elements of the value chain make up a proof of concept(right side), and some a proof of value(left side). I’ll explain the difference between the two below.
This part provides technical proof that the problem can be solved with your approach. The end result is a prototype that is usable by an end user. To get there you need:
A minimal set of data sources, with a minimal set of variables used in the experiment. Scope it down as much as you can.
Choose a method that is fit to solve your problem. Select the simplest method first and proof that it works. Linear or logistic regression is simple, a neural networks is complex.
Define the insight (to the end user) that the model generates.
Deliverable: A validated methodology.
The proof of value measures the effect of your solution on some KPI’s and results in a validated business case. This will help you get new resources to further develop your solution. To get there you need to:
Define the action that is supported by the insights generated by your proof of concept.
Figure out a way to measure the effect of this action.
Agree on a way to calculate generated business value from your measurements.
Deliverable: A validated business case.
Summarising, the proof of concept proves that the problem is solvable. The proof of value shows that the business case is viable. You’ll need both to convince your stakeholders to further invest in your use case.
There is a problem though. Your colleagues in operations are usually involved in the PoV and not familiar with data, programming, or modelling. Therefore we must hide as much complexity from the end user as possible, and only keep the bare minimum. This is often referred to as the Minimal Viable Product. Here we refer to it as the user interface. It is the minimal thing that you need to bridge the gap between the development and the operations team. The interface can be an excel sheet, a dashboard or a small web interface. Whatever helps you to bridge the gap.
Now we understand the elements that together form the canvas, it is time to fill in the canvas based on the example discussed earlier.
For the experimentation phase, we want to cut complexity at all cost. Complexity can be in any of the canvas segments. To give some examples:
| Canvas Segment | Simple | Complex |
|---|---|---|
| Value | Use Existing KPI’s | Invent new KPI |
| Measure | Manual | Automated |
| Action | ‘Fake’ the required action (without intervening in operations) | Let operations try out the solution in practice |
| User Interface | excel file | Integrate in IT system |
| Insight | 2 Categories | 100 Categories |
| Model | Linear Regression | Neural Network |
| Data | One data source, a sample of data | Many data sources, all the data |
| Business Requirements | Scope to 20% of most problematic cases | No scope |
| Technological requirements | Batch processing | Real time processing |
| Stakeholders | In one department | In many departments |
| Investments | Align project with existing budget allocations | Negotiate new budget |
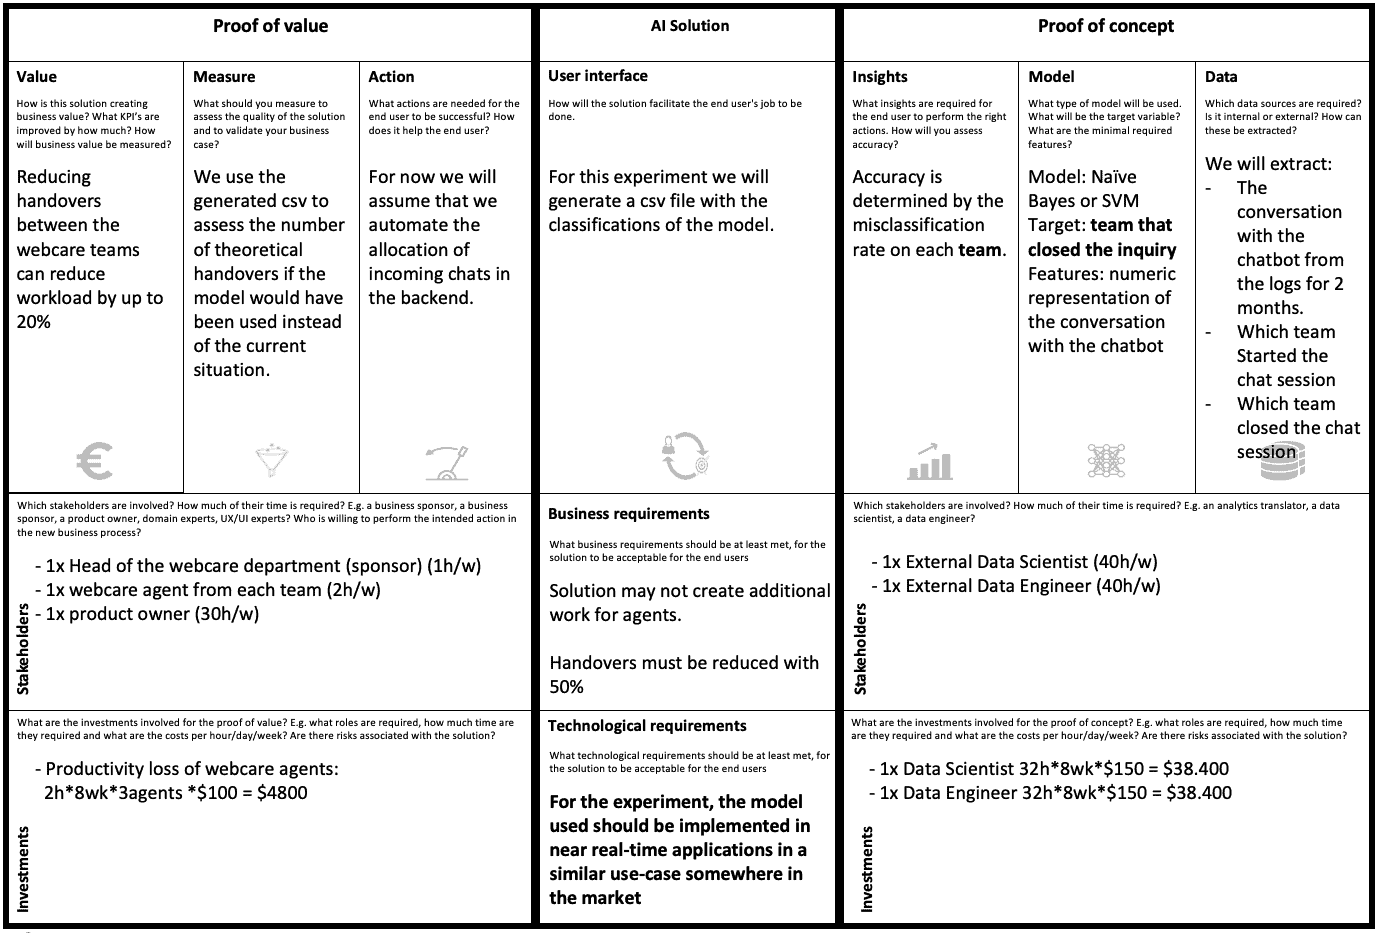
We can use the canvas to simplify our experiment. Instead of classifying the topic we could classify the team. This simplifies the insight. Additionally, we should better manage expectations. We can’t deliver real time predictions in this first experiment. Lastly, we use a complex model to start with. Our data scientist states that we need this to model complex text data, and we decide to go with it. It is a multi-class classification problem on text data after all.
After these minor changes we settle on the following experiment:
You’re now ready to negotiate with your stakeholders and get your experimentation budget… and that finalizes this blog!
We’ve introduced the Experimentation Canvas, and the value chain of data science. Also, we have seen how they result in the proof of concept, proof of value, and the minimal viable product. Lastly, we’ve provided some pointers on how to reduce experiment complexity. We hope that this is enough to get started yourself. We hope that you’ll put it good use!

